


Three Forces & the 1983 Pattern That Explain It All
“Those who fail to learn from history are condemned to repeat it.” — Winston Churchill
If you follow markets, you’ve probably seen the headlines: Gold down nearly 20% in two months. Bombs are falling in the Middle East. Oil is above $100 a barrel. And gold—the one asset every textbook says is supposed to protect you in exactly this kind of crisis—is in freefall.
It feels like gravity just reversed.
I’ve been watching this unfold, and like many of you, I was confused. But now I understand exactly what’s going on, and I wanted to share with you an excellent resource for investors and what I learned.
Stanley Druckenmiller is widely regarded as one of the greatest macro investors of the past half century. He first rose to prominence as the lead portfolio manager for George Soros’s Quantum Fund, where he helped execute the famous 1992 trade that broke the Bank of England—netting over $1 billion in a single day. Over his career, he delivered annualized returns exceeding 30% with almost no down years, earning a reputation for reading the intersection of central bank policy, debt dynamics, and market psychology.
When Druckenmiller speaks about gold, markets listen—not because he makes short-term predictions, but because he has navigated every major monetary cycle since the 1980s and understands the structural forces that ultimately drive asset prices. In the video linked below, he breaks down exactly why this gold crash is a mechanical event, not a structural one, and why the 1983 pattern matters right now.
In the video, he explained what’s really happening underneath the surface—and why this crash isn’t what it seems. Let me walk you through it below, using an analogy that stuck with me.
What If Gravity Suddenly Stopped Working?
Imagine you’re standing on Earth. You drop a pen. You expect it to fall down. That’s gravity. It’s reliable. It’s in every physics textbook.
Now imagine you drop the pen, and instead of falling, it shoots sideways. You’d think gravity broke.
But gravity didn’t break. A stronger force intervened—maybe a giant magnet, or a sudden hurricane-force wind. The rule didn’t disappear. It was just temporarily overwhelmed by something else.
That’s exactly what’s happening with gold.
The rule is: War → Fear → Gold Up.
It’s been that way for decades. But right now, three other forces are so powerful they’ve overwhelmed that rule—and they’re pushing gold down instead.
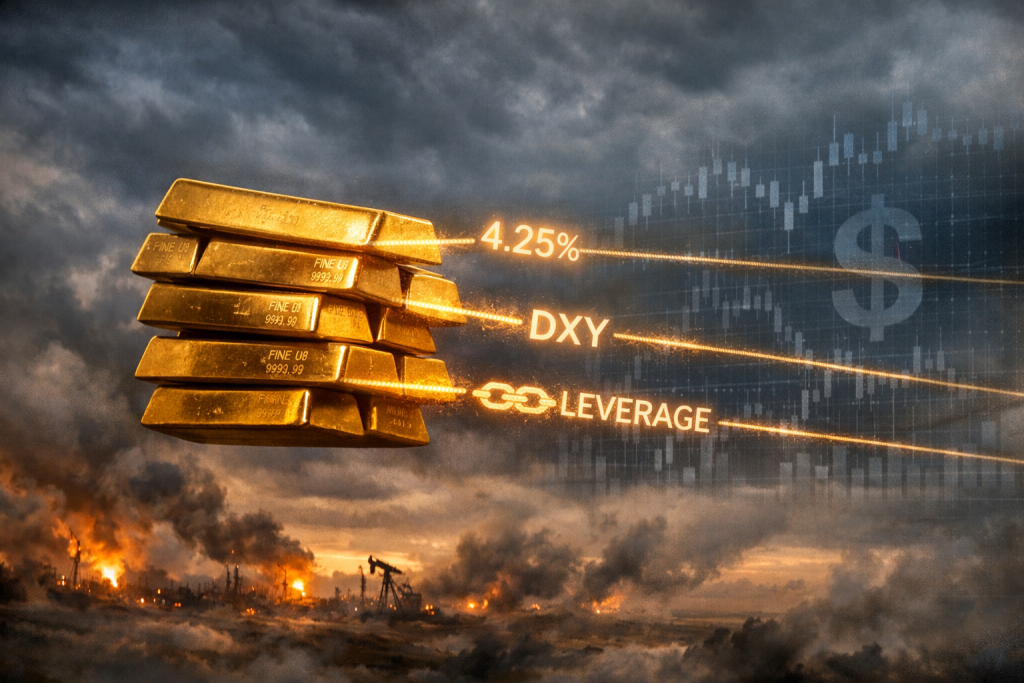
Force #1: The Rising Tide of Bond Yields
The U.S. 10-year Treasury yield recently hit 4.25%.
Gold pays no interest. It doesn’t pay a dividend. It just sits there, holding value over time. When bonds offer a safe 4.25% return, investors face a real choice:
- Hold gold (which pays nothing)
- Or hold Treasuries (which pay 4.25% with virtually no risk)
At 1% or 2%, gold wins easily. But at 4.25%, the “opportunity cost” of holding gold becomes painful. So money flows out of gold and into bonds. That’s one giant magnet pulling gold sideways.
Force #2: The Dollar’s Strong Arm
Gold is priced in U.S. dollars. When the dollar strengthens, gold becomes more expensive for anyone holding other currencies.
During this crash, the dollar index climbed toward 100—a level that triggers automatic selling by algorithmic trading systems. These systems don’t care about war headlines. They see a strong dollar and a rising 10-year yield, and they sell billions in paper gold contracts. No human makes the call. It’s programmed.
Force #3: The Leverage Trap
This one hurts, because it involves regular investors like us.
Over the past couple of years, retail investors poured over $70 billion into gold ETFs, many of them leveraged (funds that amplify daily moves). These funds have a built-in mechanism: when gold falls, they must sell to rebalance—every single day.
So a small dip turns into forced selling, which pushes prices lower, which triggers more forced selling. It’s a vicious cycle that turns a normal correction into a 20% crash. And it happens regardless of whether you still believe in gold long-term. The product structure overrides your conviction.
The 1983 Pattern: Sovereign Sellers
Here’s where the Druckenmiller video added a piece I hadn’t fully understood.
In 1983, gold crashed during a similar setup. The cause wasn’t a loss of faith in gold—it was sovereign governments selling to raise cash. Back then, Gulf oil states saw oil prices collapse and sold gold to cover their budgets.
Today, the Strait of Hormuz is closed. Oil is over $100 a barrel, but countries like Saudi Arabia, Qatar, and Kuwait can’t ship it. Storage is filling. Their revenue has collapsed, so they’re doing exactly what they did in 1983: selling gold to cover their cash shortfall.
These are large holders—hundreds of tons of gold between them. They don’t need to sell all of it to move the market. Just enough to fill the gap.
So we have a sovereign selling wave, layered on top of algorithmic selling, layered on top of leveraged ETF unwinds. All happening at once.
The Signal Hidden in the Noise
Now here’s the part that keeps me calm.
There are actually two gold markets: the paper market and the physical market.
- Paper gold (futures, ETFs) crashed. That’s what we see in the headlines.
- Physical gold (bars, coins, central bank reserves) tells a completely different story.
Physical premiums stayed elevated. Central banks kept buying. The Shanghai Gold Exchange traded at a premium to Western prices. JP Morgan and Deutsche Bank did not change their year-end price targets—$6,300 and $6,000 respectively—even after the 20% drop.
The institutions that move billions in physical gold looked at all the same data we did and said: The structural case hasn’t changed.
What I’m Watching Now
I’m not watching the gold price itself. I’m watching two numbers that Druckenmiller highlighted:
- The Dollar Index (DXY) – If it breaks below 97, the headwind turns into a tailwind.
- The 10-Year Treasury Yield – If it drops below 3.5%, the opportunity cost of holding gold collapses.
Both of these are likely to move eventually, because the U.S. has $36 trillion in debt and interest payments now exceed the defense budget. Sustaining 4.25% rates against that debt load is mathematically unsustainable. When rates fall, the mechanical pressure on gold reverses—and historically, it reverses fast.
The Bottom Line
This crash feels like gravity breaking. But gravity didn’t break. It was just temporarily overpowered by three forces: rising yields, a strong dollar, and a cascade of forced selling.
The structural case for gold—central bank buying, debt trajectories, and its 5,000-year role as a store of value with no counterparty risk—is as strong today as it was at $5,500.
The investors who sold at the bottom of the 1983 crash and waited for “confirmation” missed the entire next leg up. The ones who understood the difference between a mechanical sell-off and a structural reversal accumulated through the noise and were rewarded.
I’m not here to tell you what to do with your money. But if you own gold and you’ve been panicking, I’d encourage you to watch his video and ask yourself: Am I reacting to the short-term paper price, or am I focused on the long-term structural picture?
Because in moments like this, the difference matters more than ever.
Have thoughts? I’d love to hear whether you’re holding, adding, or watching from the sidelines. Drop a comment below—it helps me know what to cover next.

 “Outstanding, sophisticated, and mesmerizing…a spiritual intrigue similar to Dan Brown’s The Da Vinci Code.” —ForeWord Reviews